SPHERULITE More Technical Properties
The Lambda Ratio
HOW WE OBTAIN THE LAMBDA RATIO
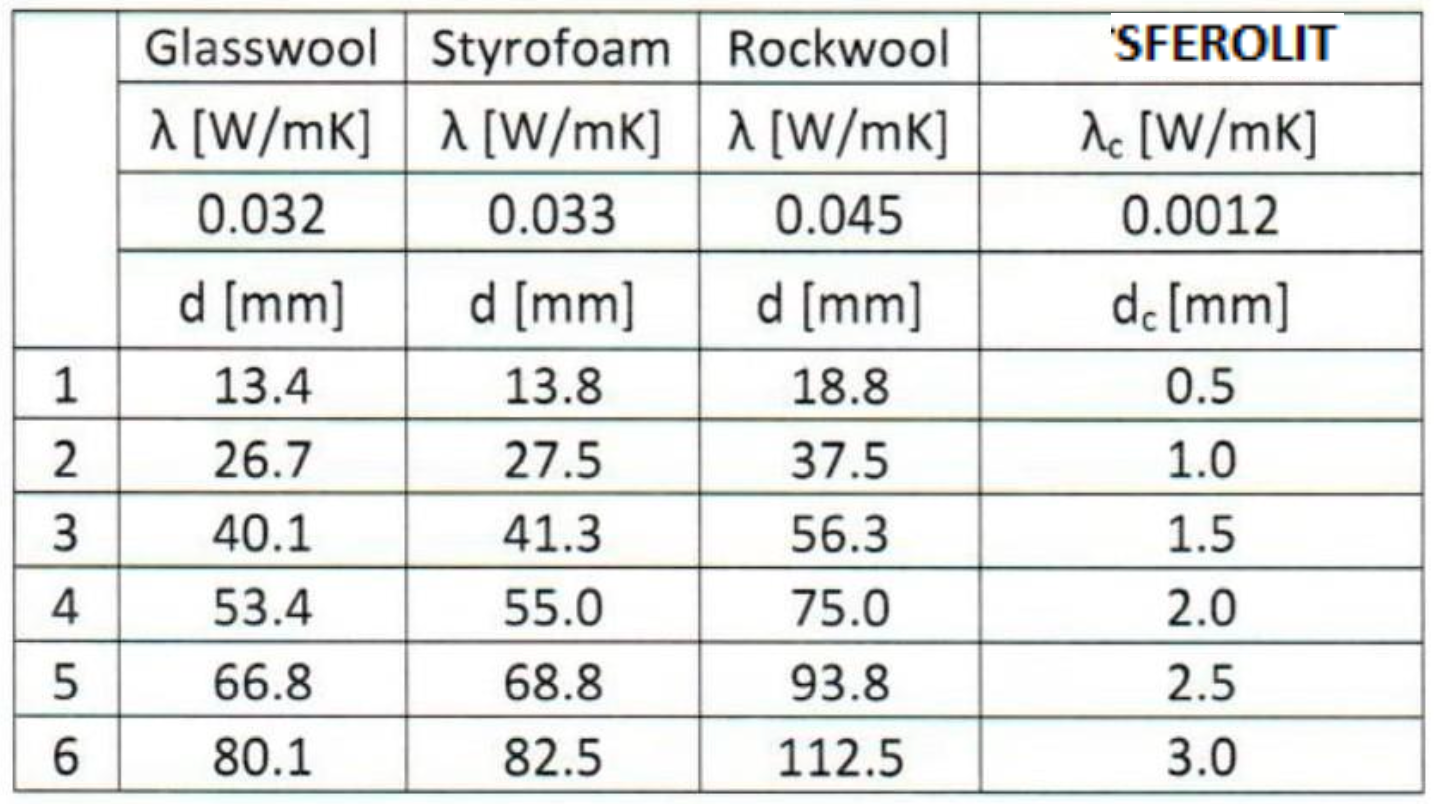
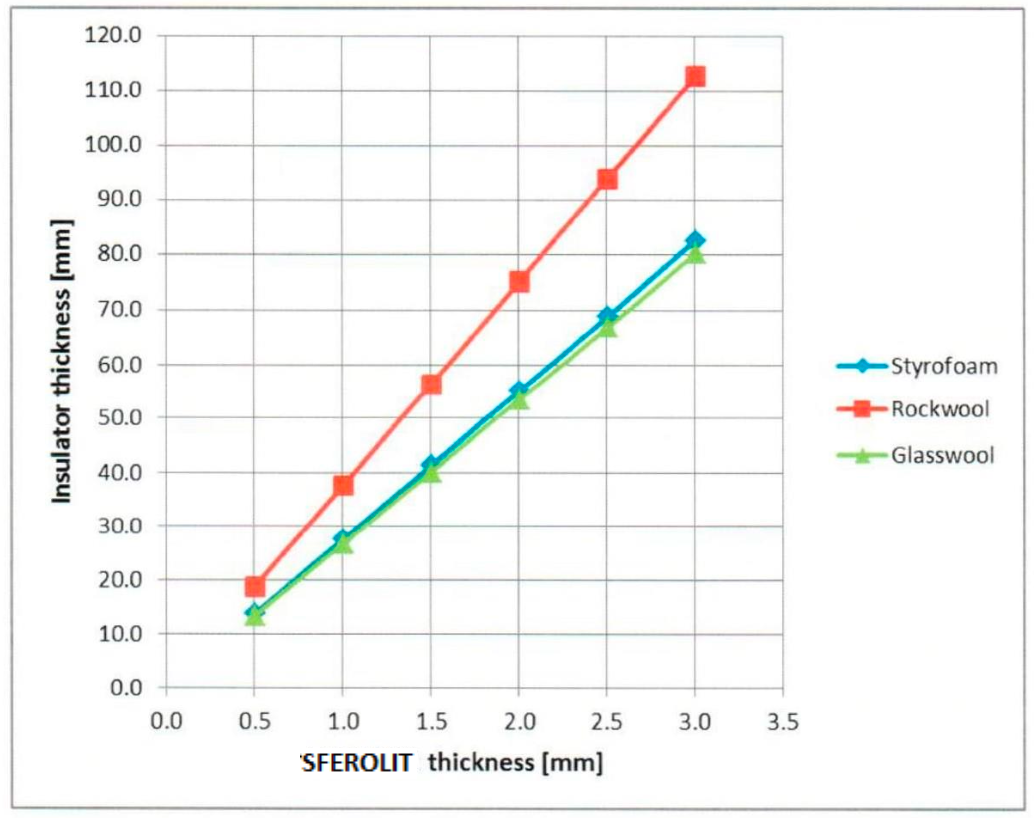
λc (λobl) = 0,001 and 0,002 W/mK
FOR THERMAL INSULATION PAINTS WITH THICKNESS APPLICATIONS FROM 0.5 TO 4 MM THICK?
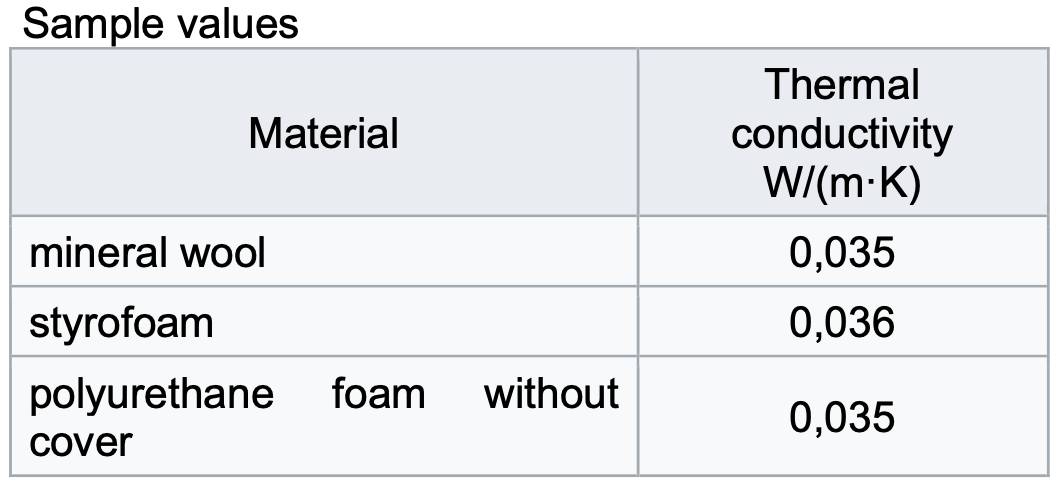
Well- mineral / rock wool, polystyrene, pur foam, etc. are calculated on the basis of the conducted thermal conductivity test.
There are several standards depending on the construction requirements of the material, building codes (EU, USA, Africa, Australia, etc.):
ASTM C177; ASTM C335 - 05ae1;
ASTM C1363-05; ASTM C518;
DIN EN 12667/12939; ISO 8301/8302;
ISO 8894-1 (EN 993-14);
ASTM E1225-04; After the test is performed by an
accredited institute, the W/(m·K) coefficient is determined.
In the case of thermal insulation paints, we use a different method of determining such a low coefficient as λc (λobl) = 0.001 - 0.002 (SFEROLIT).
Sferolit thermal insulation paints have excellent insulation properties at operating temperatures from -50 ° C to + 600 ° C (temperature range depends on the type of paint). In addition, the second very important indicator is the reflectivity of the paint. These two parameters are important to calculate the true insulation parameter of a thermal insulation paint. Therefore, two important tests should be performed:
1.
Testing the thermal conductivity of thermal insulation paint in accordance with the applicable standards of construction law (ASTM C177; ASTM C335 - 05ae1; ASTM C1363 - 05; ASTM C518; DIN EN 12667/12939; ISO 8301/8302; ISO 8894-1 (EN 993- 14 ); ASTM E1225-04); After testing by an accredited institute, the lambda is determined. The W / (mK) coefficient of thermal insulation paints will be different than the above-mentioned thermal insulation materials (wool, polystyrene, pur foam).
However, it must be remembered that paints are tested with a thickness of up to a few millimeters. Wool or polystyrene do not have such thin insulation (for example, they are 5, 10, 20 cm).
2.
The second important test is the determination of the Total Solar Reflectance Index (TSR). TSR is calculated on the basis of e.g. ASTM E903 or equivalent EN standard. The emissivity coefficient necessary to calculate the SRI coefficient is determined in accordance with our own methodology using a thermal imaging camera. The obtained values will allow the calculation of the SRI and the surface temperature based on the standard, e.g. ASTM E1980-11 (2019) or the equivalent of the EN standard.
Obtaining the above two test results, we obtain, according to the formula, the final thermal conductivity coefficient
λc (λobl) 0.0012 W/(mK)
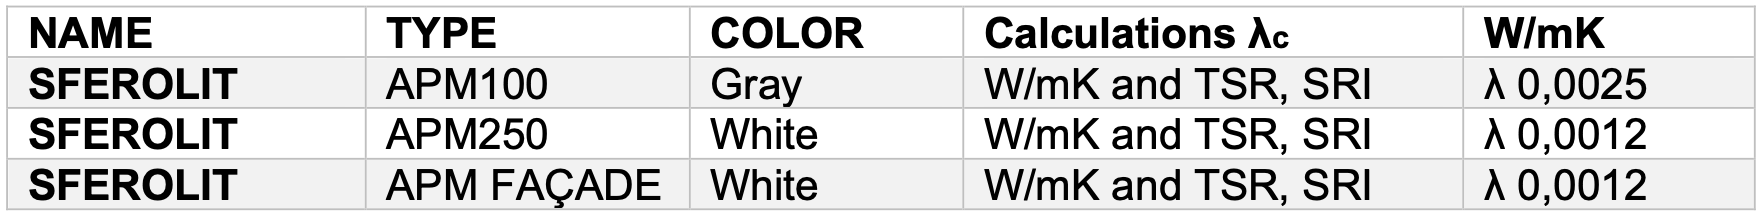
Table U-Value
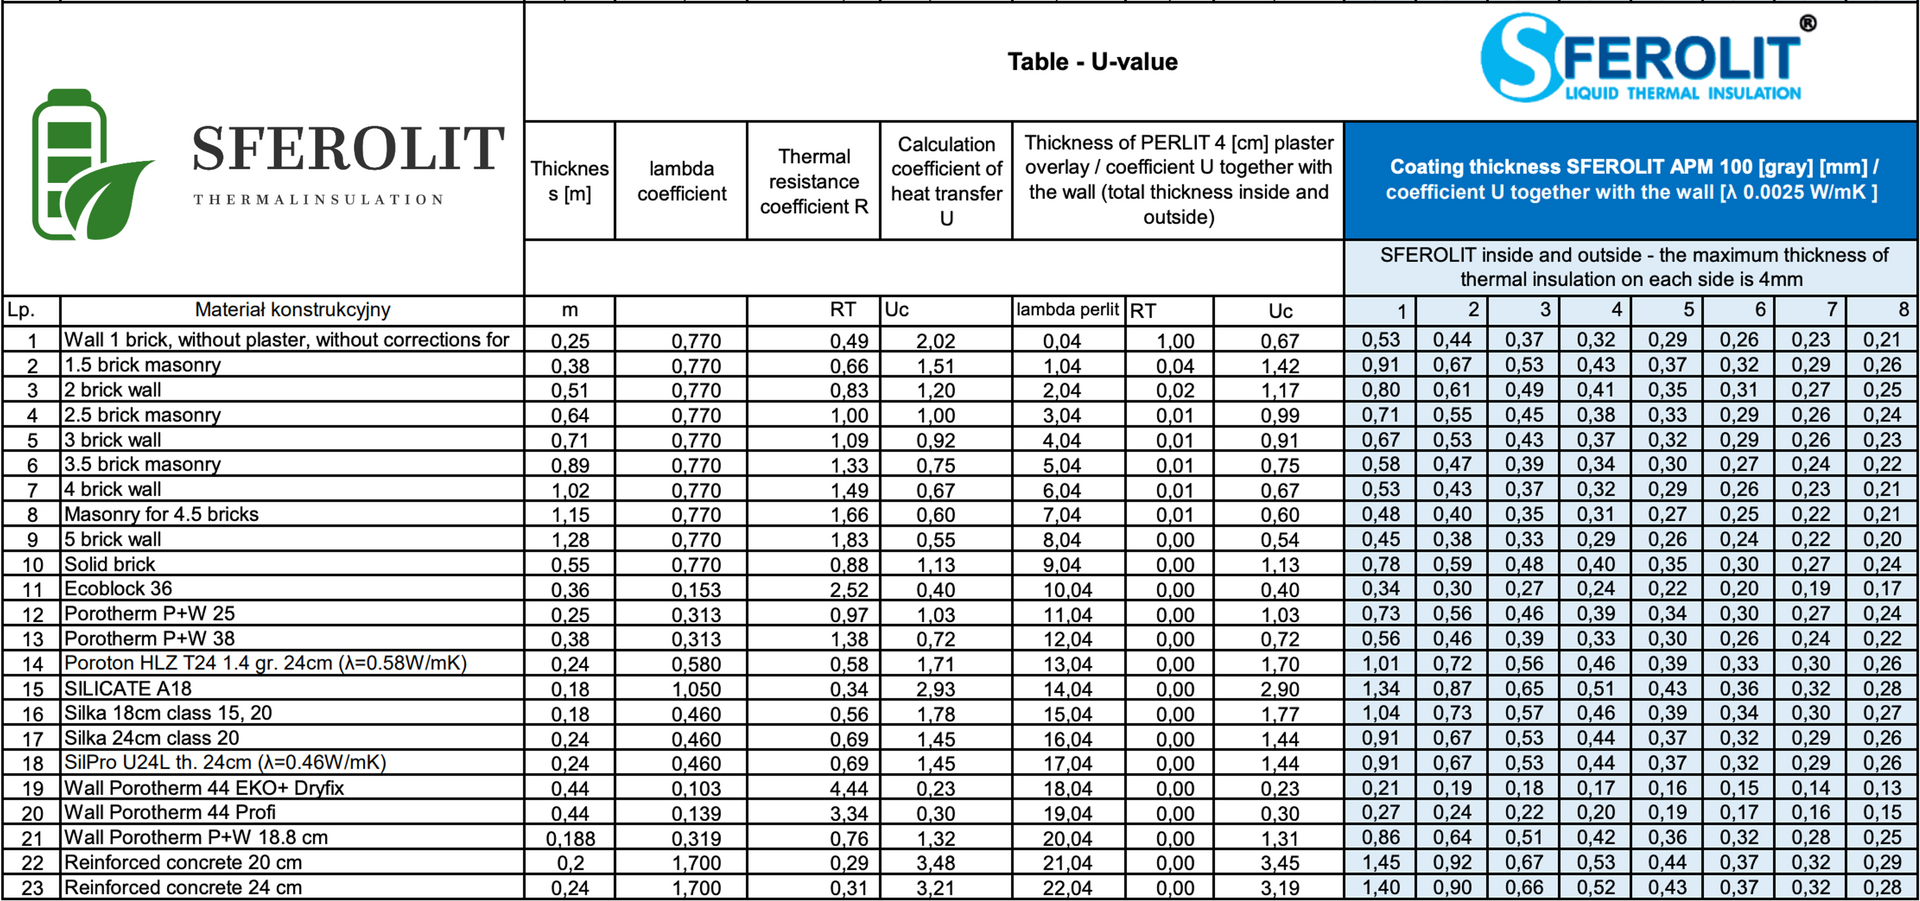
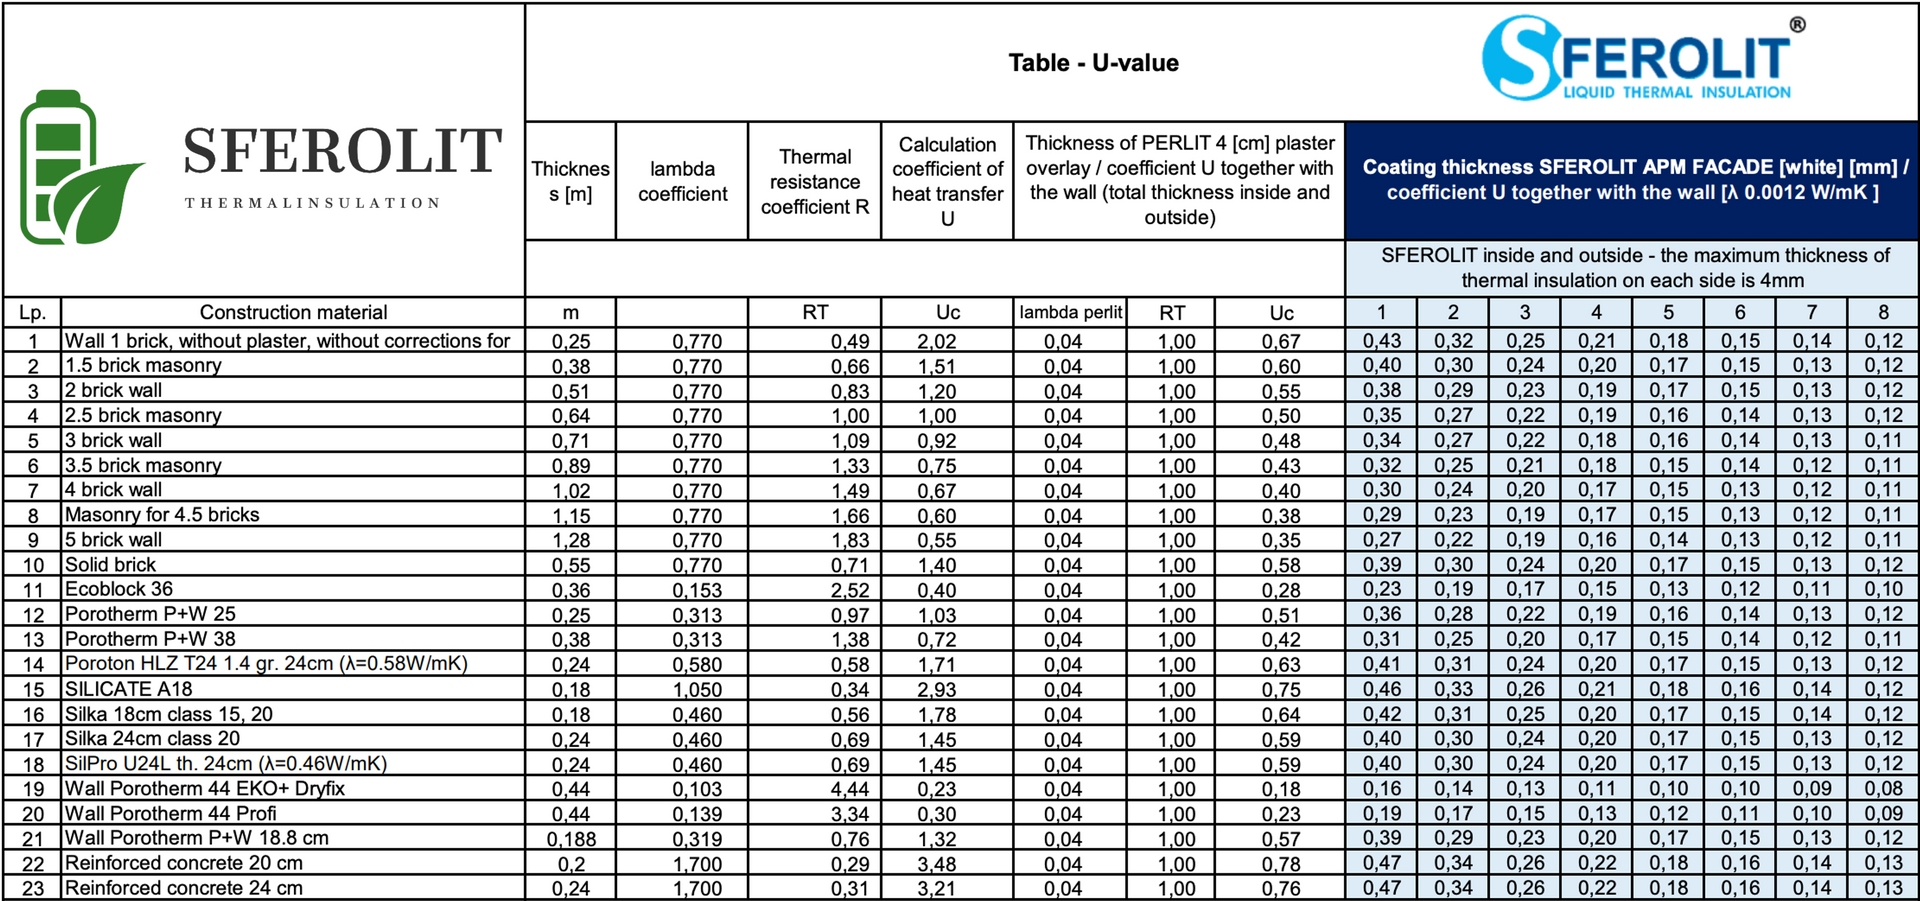
THERMAL CONDUCTIVITY
The table below provides examples of typical insulators that can be replaced with Sferolite, considering similar requirements for heat flux and temperature difference between the outside and inside temperatures:
Insulator Type | Example Materials
-------------- | -----------------
Fiberglass Fiberglass batts, rolls, or loose-fill
Cellulose Cellulose fiber insulation
Mineral Wool Rock wool or slag wool
Expanded Polystyrene (EPS) | EPS foam boards or beads
Extruded Polystyrene (XPS) | XPS foam boards
Please note that the suitability of Sferolite as a replacement for these insulators depends on specific application requirements and should be evaluated on a case-by-case basis.
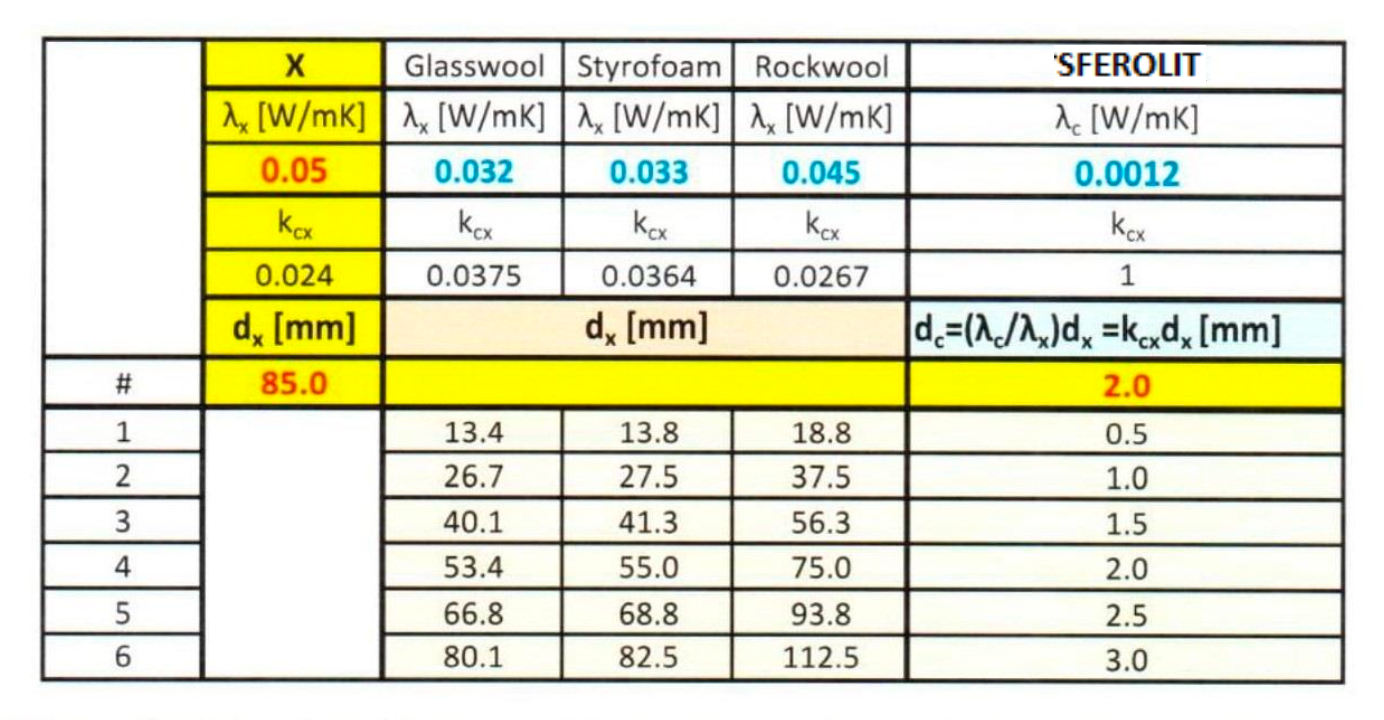
Table of equivalent thickness for applications on hot pipes
Determination of TSR and SRI
1
The TSR factor was determined in accordance with the ISO 22969-2019-7 standard.
The spectral characteristics of the coatings were determined in the range of solar radiation
of 300-2500 nm using a V-670 UV / VIS / NIR double beam spectrophotometer with an integrating ball, Jasco. The Total Solar Radiation Index (TSR) was calculated based on ASTM E903 using the developed calculation program. The given result is the average of 3 measurements.
2
The emissivity coefficient was determined using a FLIR thermal imaging camera with the E60 symbol based on our own methodology. The given result is the average of 3 measurements. The SRI was calculated from ASTM E1980-11 (2019) Standard Practice for Calculating Solar Reflectance Index
of Horizontal and Low-Sloped Opaque Surfaces.
Laboratory test results.
Marked Coefficient
TSR, %
Emissivity
SRI
APM 100
41,66
0,97
50
APM 250
86,30
0,98
110
APM Facade
89,43
0,98
114
Scanning electron microscopy
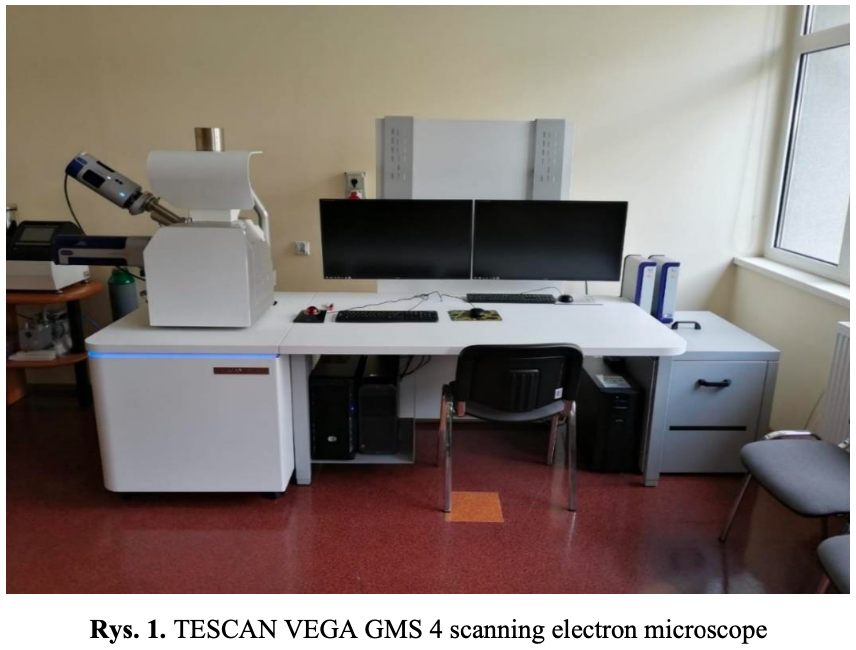
The research was carried out by scanning electron microscopy using a TESCAN VEGA 4 microscope (Figure 1). The tests consisted in the application of a scanning, focused and concentrated electron beam of a specific energy onto the analysed area of the sample surface. The electron beam penetrated the surface layer of the material, exciting various signals from the layer under test. The excited secondary electron (SE) signal allowed imaging of the topography of the observed surface.
Test results
Figure 2 shows images of the surface morphology of the sheet metal marked SFEROLIT-1.5-2. The observed outer surface is characterised by areas of high inhomogeneity, discontinuity and protrusion. Figure No. 3 shows the surface of the coating, characterised by a high density of products with rounded shapes, with distinct voids in between.
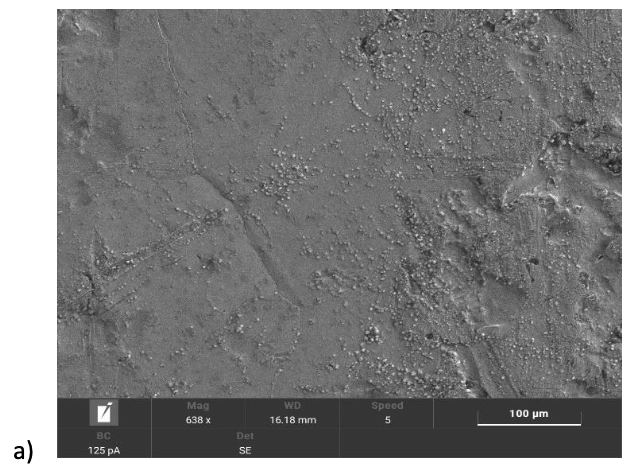
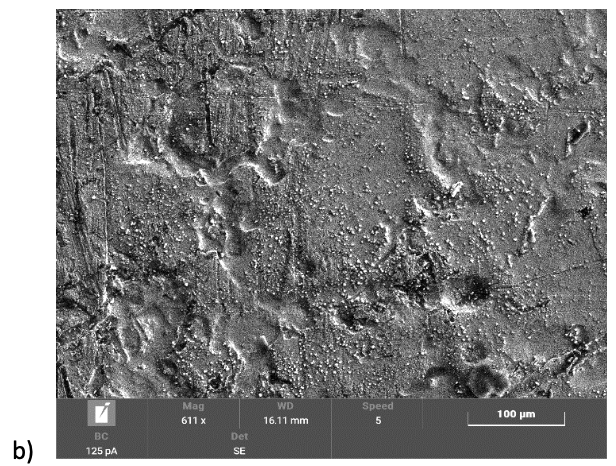
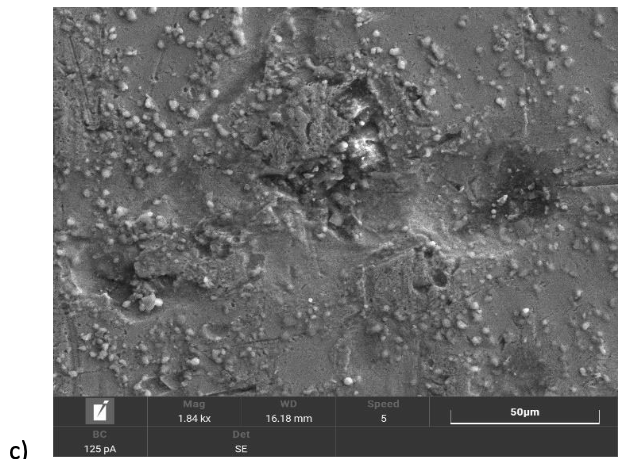
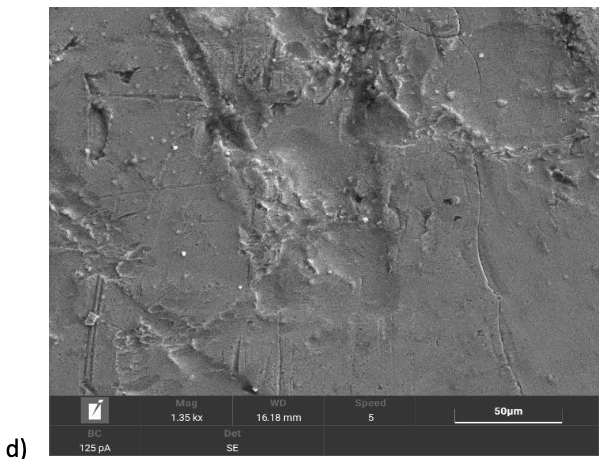
Fig. 2. Plate surface of SFEROLIT-1.5-2; (a) overlap 638x, (b) overlap 611x, (c) overlap 1840x, (d) overlap 1350x.
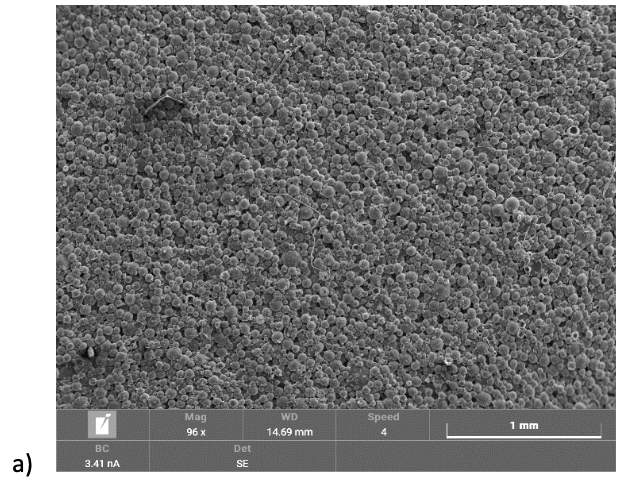
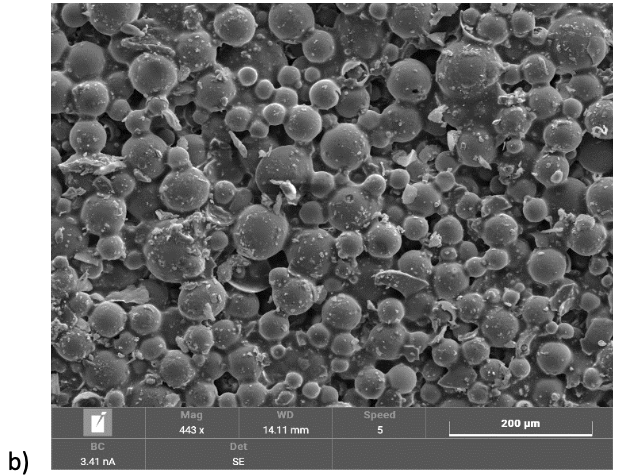
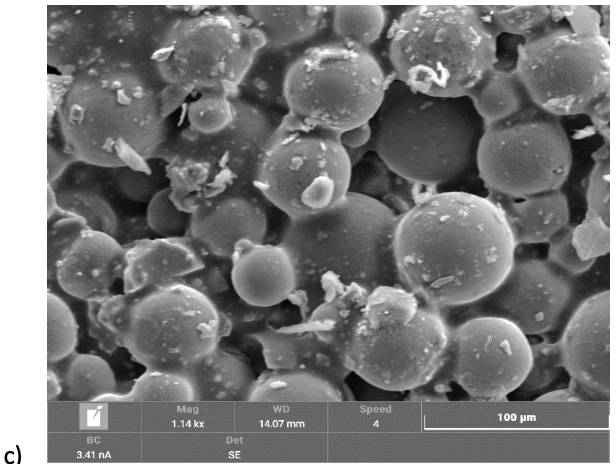
Fig. 3. Coating surface applied to SFEROLIT-1.5-2 sheet; (a) coating 96x, (b) coating 443x, (c) coating 1140x.
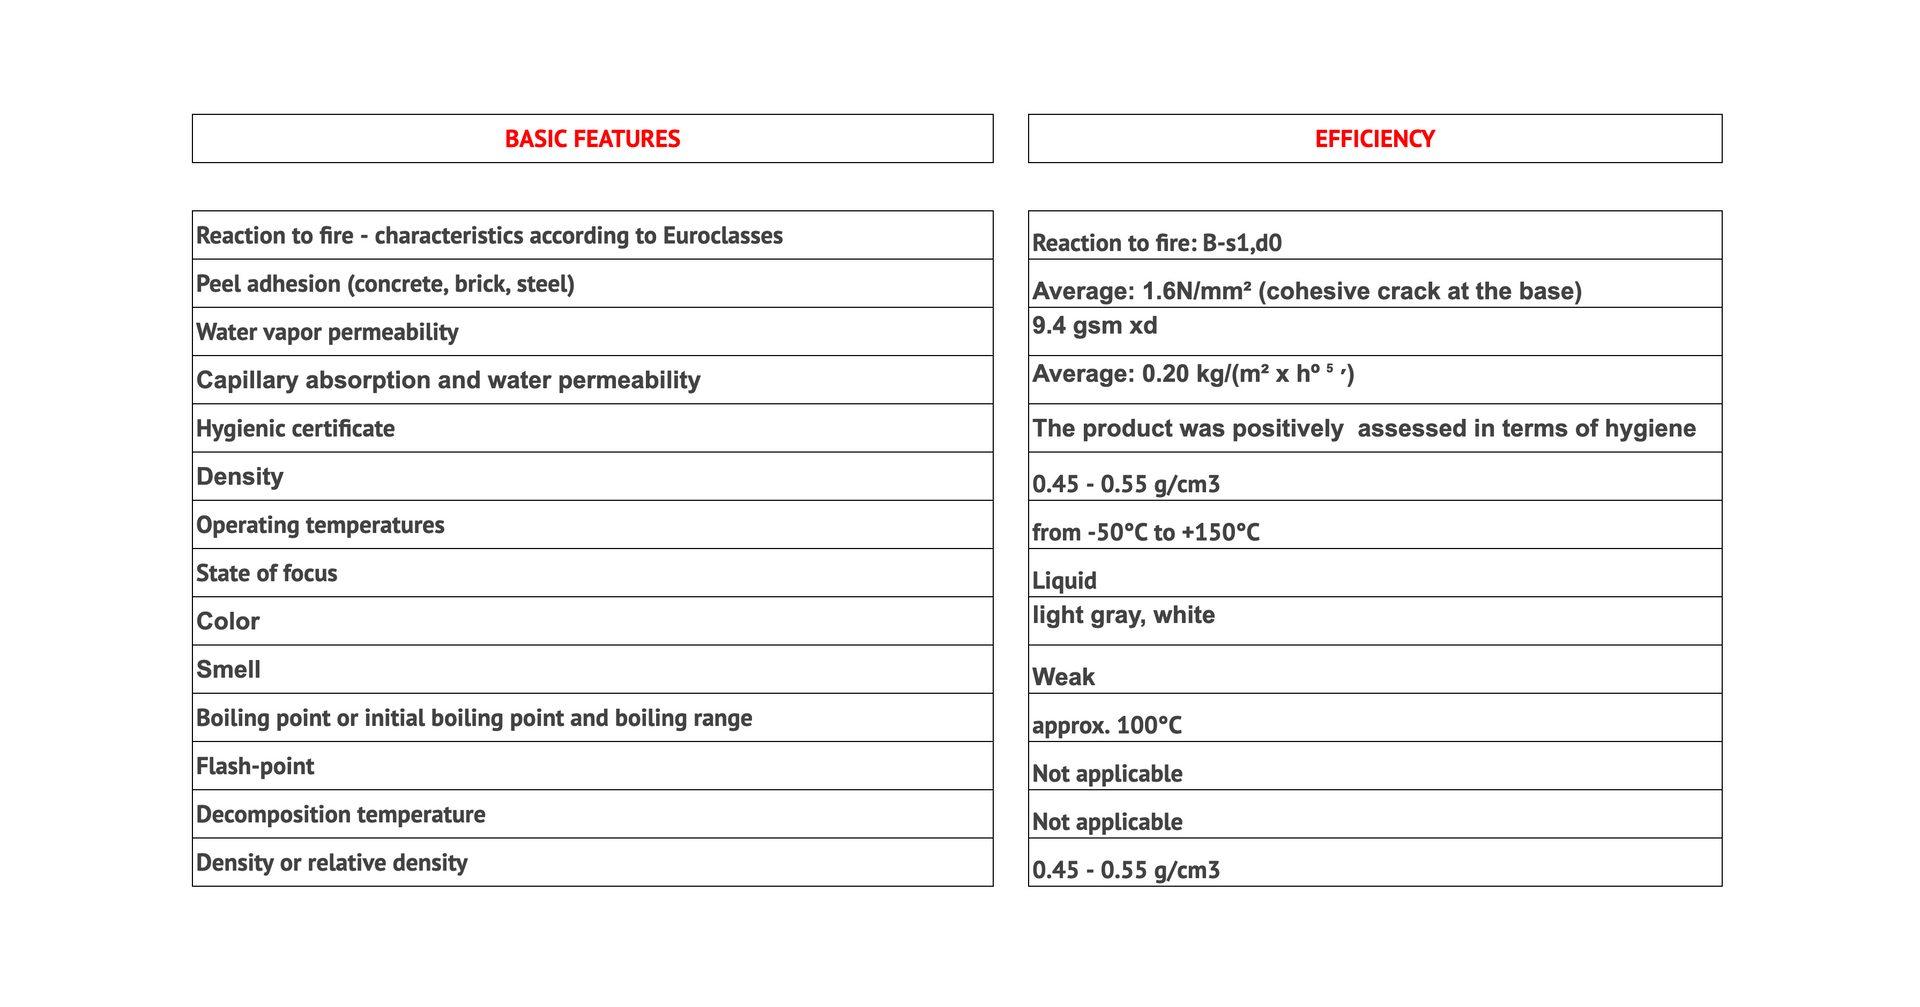
PHYSICAL AND CHEMICAL PROPERTIES